TOAD
Quick
Guide
General Shortcuts
Schema Browser Window
Using Favorites
Procedure Editor
and
Debugger (Profiling)
SQL Editor Window
Data Subset Wizard
Using Auto Replace
Project Manager Tutorial
Action Palette or Application Designer or
Automation Designer (Save
repetitive actions like a macro)
Action Console
Object and Schema Compare
Statspack and AWR Browser
Data Import / Export Browse
Trace File Browser
Code Expert
Database Browser
RMAN Script Templates
Data Generation
Rebuild Multiple Objects
SGA Trace Optimization
Tuning SQL (Optimize SQL)
Run TOAD on a USB Drive
ER Diagram
SQL Optimizer
DB Monitor (or Database Monitor)
Script Manager
Search Functionality
Code Road Map
Other Good Tools
Resources Collected
Download....
Toad for Oracle
Editions
As you may already know, there are different editions of Toad
for
Oracle:
- Toad Base – maybe known as Standard (includes Knowledge Xperts
+
Debugging) - essential Toad features
- Toad Professional (Toad Base + extra features) - focussed on
coding best practices
- Toad Xpert (Toad Professional + SQL Optimizer) - focussed on
application performance
- Toad Development Suite (Toad Xpert + Quest Code Tester +
Benchmark Factory for Oracle) – end-to-end Oracle development
solution
- Toad
DBA Suite (Toad Xpert + DB Admin Module+ Toad Data Modeler +
Benchmark
Factory for Oracle + Spotlight on Oracle) – complete DBAs
toolkit for
administration, diagnostics and tuning
Does Toad need OEM
?
Toad offers optional features in the DB Admin Module (under
Database/Monitor) which WILL ACCESS the Oracle OEM Diagnostics
Pack
such as :
- ADDM/AWR Report Generator – enables snapshot management and
shows
both AWR and ASH reports
- AWR Browser – graphical representation of data collected from
AWR
- ASM Manager – enables management of ASM disk groups and
clients
Toad does offer alternate ways to determine performance
bottlenecks without the use of ADDM/AWR such as the StatsPack
Browser,
TK Prof interface, Database Monitor, Session Browser and the Quest
SQL
Optimizer’s SQL Inspector to name a few. However, if you are
already
licensed to use the OEM Diagnostics Pack and you wish to get
additional
value from it, you can use the functionality we offer in Toad.
If you are on Oracle database 10g and above, you can use the
Oracle Tuning Advisor feature in Toad Base (9.6 and higher) which
WILL
access both the Oracle OEM Tuning Pack and Diagnostics Pack.
Alternatively, you could use Toad Xpert, Development Suite or
DBA
Suite Editions and use the Quest SQL Optimizer which DOES NOT
access
any of the Oracle OEM Packs at all. In addition, Quest SQL
Optimizer
offers a unique way to rewrite your SQL code for maximum
performance.
TOAD
DB
Module
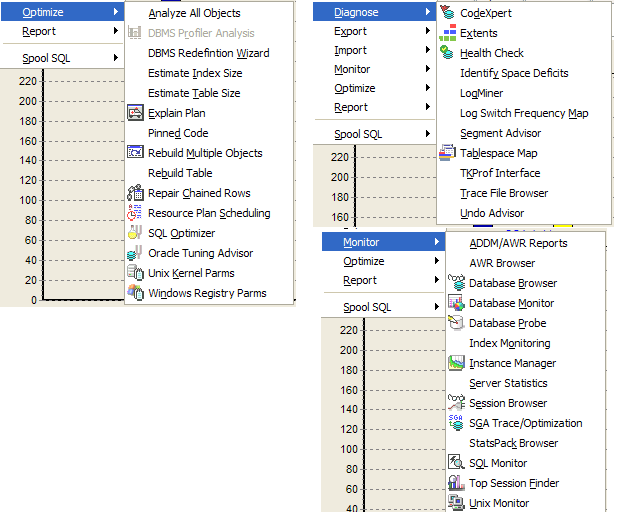
Screen Shots of its content:
Database - Administer - Compare
and
Import Options

Database - Optimize - Diagnose -
Monitor Options
General
ShortCuts
| ACTION |
KEY
|
| Schema Browser |
F2 |
| SQL Editor |
F3 |
Describe an Object (also
CTRL+Rigth Click). Just put the cursor over the object
|
F4
|
| Execute code as Script (from
SQL
Editor) |
F5
|
| Jump to that Object (Browser
Window) |
SHIFT + F4 |
| Toggle between SQL Editor and
Results tabs |
F6 |
| Clear all text (from SQL
Editor)
or Trace Into on the Procedure Editor |
F7 |
ReCall SQL History (opens the
SQL Statement Recall panel)
|
F8 |
| Display
Previous/Next Statement
used |
ALT
+
Up
or
Dn
|
| Provides a Code
Template
(with Rigth Click - Editing Options - Code Templates I can
edit them) |
CRTL + Space |
| Run Statement (from SQL
Editor)
or Compile (on the Procedure Editor). Execute all statements
in the
Editor |
F9 |
| Verify statement without
execution (parse) |
CTRL + F9 |
| Run Statement at Cursor |
SHIFT + F9 |
| Execute as script or Run
(continue execution) in the Procedure Editor for PL/SQL
debugging |
F11 |
| Run to cursor in the
Procedure
Editor for PL/SQL debugging. |
F12 |
Convert Text to Lowercase /
Uppercase
|
CTRL + L / U
|
| In the data grids, goes to
the
TOP/END of the recordset |
CTRL + HOME or END |
| Clicking on a
procedure/function
name while holding the <CTRL> key takes you to the
place where
that name is defined. |
<CTRL>Click on
identifier |
Moves to the selected
procedure
in the body from the spec (up or down)
|
CTRL + SHIFT + UP or DOWN
|
| Completion dropdown. As you
type
the procedure name, the dropdown does an incremental search
in the
list. |
CTRL .
|
| If you begin a procedure call
and pause after the first (,
Toad parses
the procedure spec and gives you parameter hints. You can
cycle through
parameters for overloaded functions. |
( |
| Execute Explain Plan on the
Current Statement |
CTRL + E |
| Recall Named SQL Statement |
CTRL + N |
| Columns Dropdown |
CTRL + T |
| Navigate to the next results
panel tab |
CTRL + ALT
<PageDOWN> |
| In the data grids, goes to
the
top / End of the recordset |
CTRL + HOME or END |
| Completely expand dependency
tree views |
CTRL + SPACE |
| Quick Describe anywhere in
Toad
to find objects and display their information in the
Describe Objects
window. |
CTRL + D |
Schema Browser
Window
The Schema Browser is your gateway to the database objects in your
Oracle instance. Simply select the user/schema, database object
type,
and database object, then immediately gain access to all the
pertinent
information for that object. For each object you can generate its
DDL,
see Used BY, check stats,
indexes, constraints, etc
For Table Data you can:
• Create Insert for All Rows
• Create Insert statements replacing values (example use
sysdate
for dates, sequences, etc)
• Save as HTML Report
• Generate very nice reports
• Detect Duplicate Rows
• Record Count
• Perform Multi-Select and then work with those rows only
• Find Data
• View/Edit Query
• Create in Another Schema
• Compare Data
• Rebuild Objects
• Master/Detail Report
For Code
CodeXpert to provide Tuning in your code
Customize
Left
Hand Side (LHS)Tabs
Customize tabular view by Right clicking in the white area of the
object icon bar and selecting the configure box. Double click on the
box intersecting the Tab you would like to hide and the box that
reads
“VISABLE.”
Captions can be modified to display a user-defined description in
the
tab. Or if English isn‟t your first language, translate “Tables” to
“Les Tables” (yes, this is a joke.)
Use the 'Up' & 'Down' arrow buttons to re-order the tabs, or use
the 'Alphabetize' button to make items easier to find, versus
'Tables'
and 'Views; appearing first and second respectively.

You can also customized. You can manually add any of these detail
items
to the left-hand-side (LHS) by mouse-right-clicking in the column
header on the LHS. For example you could add „Num Rows‟ for Tables
and
sort by table size stats for estimated number of rows.

History
Quickly navigate to objects you've browsed to previously. Use the
"Sundial" button.
Data
View and modify a table's data by selecting table from the object
tabular view, and the DATA from the right side of the screen
a) Sort/Filter the data by
selecting the icon resembling a funnel
b) Select Columns- to limit
the
columns shown in the grid right click and choose SELECT COLUMNS
c) Save the data to a file
format of your choice by right clicking in the data grid and
selecting
Save As. This gives the choice of format and saving the data to a
file
or copying to the clipboard.
d) Create Insert Statements
by
right clicking the data grid and selecting create insert statement.
It
will save inserts on clipboard to be run from Editor.
e) Customiz Layouts by
dragging
and dropping columns into select order. Fix a column or set of
columns
by right clicking and selecting fix current column. View only
desired
columns by right clicking and choosing select columns. To save a
desired layout, select VIEW>OPTIONS>SCHEMA BROWSER> DATA
and
GRIDS>DATA GRIDS and check "Save Layouts"
f) Reporting- To access
TOAD's
Fast Report reporting tool, right click in the Data Grid and select
"Report". You will find a report generation wizard to walk you
through
report creation. You can also access this via the "Grid" Toad menu
item, e.g. GRID>Report.
Using Favorites as a
Custom Schema Browser
Often in TOAD, you need to work with the same group or groups of
objects. For example, you might only need to routinely work with the
production tables for CUSTOMER and EMPLOYEE, their indexes and
views.
So you would like to have a customized Schema Browser for just those
objects. TOAD offers the Favorites tab so that you can
easily and quickly work in this manner.
It can be a huge productivity enhancer. You can group your DB
objects
by different folders.
Once you
created your folders, you need to browse to your favorite DB object,
rigth click on it and select "Add to SB Favorites List"
Procedure
Editor
Window and Debug Menu (Profiling, Debugger)
First of all, some concepts:
- Breakpoints are a
pre-determined, unconditional stopping point.
Code is executed and processing is stopped when this line of
code is
encountered. The rough equivalent of this would be to put a
"pause"
statement into your code. Using a symbolic debugger, you’re able
to
examine and change variable content as needed for your test.
- Conditional breakpoints
are similar to breakpoints, but they’re
based on the content of a variable. When the condition is met,
code
processing is suspended at the point where this breakpoint is
inserted.
- Watches display the
contents of variables while processing is
occurring and when processing is stopped via a breakpoint or
when the
routine comes to an end.
Debugger
Shortcut
Keys
ACTION
|
KEY
|
| Set or Delete a Breakpoint on
the current line |
SHIFT + F5 |
| Add watch at cursor |
CTRL + F5 |
| Trace Into |
SHIFT + F7 |
| Step Over |
SHIFT + F8 |
Display mouse right-click
popup
menu
|
F10
|
| Trace Out |
SHIFT + F10 |
| Compile |
F9 |
| Execute Current Source |
SHIFT + F9 |
| Set Parameters |
SHIFT + CTRL + F9 |
| Run (continue execution) |
F11 |
| Run to Cursor |
F12 |
Display Breakpoints
|
CTRL + ALT + B
|
Display DBMS Output
|
CTRL + ALT + D
|
Evaluate/Modify
|
CTRL + ALT + E
|
Display Watches
|
CTRL + ALT + W
|
Rigth-Click
Menu
- You can easily create the sentence for DBMS_OUTPUT with just a
right
click. Step over the variable to monitor, then Right Click and select Output Statement
- Make Output Statement, then go to the section that
you want to
show
and press CTRL+V
- Find Closing Block
- Bookmarks
- Comment/Uncomment Code
The
Toolbar for Debugger

From left to right:
•  The lightning bolt is the Run button. This button will
execute the
procedure in debug mode. Execution
will
only
stop
if
a breakpoint is
encountered or if an exception is called.
You can hit this button at any point during execution. The program will start up from where it
left
off and go until it reaches the end of your program, another
breakpoint, or an
exception.
The lightning bolt is the Run button. This button will
execute the
procedure in debug mode. Execution
will
only
stop
if
a breakpoint is
encountered or if an exception is called.
You can hit this button at any point during execution. The program will start up from where it
left
off and go until it reaches the end of your program, another
breakpoint, or an
exception.
• The (...) parameter
allows
you to set any IN variables
to
the package
and/or procedure.
•  Next is the Step Over button,
which allows you to walk through
the
PL/SQL code one line at a time. This button will skip any
procedures
that are called. The first time you hit the button; the program will
execute
and stop on the first line of code. If
you hit the button again, Toad will go to the next executable line
of
code.
Next is the Step Over button,
which allows you to walk through
the
PL/SQL code one line at a time. This button will skip any
procedures
that are called. The first time you hit the button; the program will
execute
and stop on the first line of code. If
you hit the button again, Toad will go to the next executable line
of
code.
•  The fourth
button is the Trace Into
button. Both this button
and the
Step Over button walk through
PL/SQL
code one line at a time, but Trace
Into will enter any called procedures or functions and execute that
code one line at a time. Right before your debug session starts,
Toad
will prompt you
to compile ‘referenced objects’ with debug information.
This will only come into play if you want to
‘Trace Into’ referenced objects inside your PL/SQL program. If you do not plan on doing this, then you
can say ‘No.’ If you do decline this option, you will not be able to
debug by
using ‘Trace Into.’
The fourth
button is the Trace Into
button. Both this button
and the
Step Over button walk through
PL/SQL
code one line at a time, but Trace
Into will enter any called procedures or functions and execute that
code one line at a time. Right before your debug session starts,
Toad
will prompt you
to compile ‘referenced objects’ with debug information.
This will only come into play if you want to
‘Trace Into’ referenced objects inside your PL/SQL program. If you do not plan on doing this, then you
can say ‘No.’ If you do decline this option, you will not be able to
debug by
using ‘Trace Into.’
• Next is the Trace Out button;
it
exits Trace Into code.
•  The last button is the Run to Cursor button. Place
your keyboard cursor on the line of code you
are interested in. Hit this button,
and
Toad will run to that line and stop. Be
sure
to have your cursor on an executable line, or this will not work.
The last button is the Run to Cursor button. Place
your keyboard cursor on the line of code you
are interested in. Hit this button,
and
Toad will run to that line and stop. Be
sure
to have your cursor on an executable line, or this will not work.
•  The
hand button is the Halt Execution key, and it will
stop execution
of the PL/SQL routine retaining watch and breakpoint settings.
The
hand button is the Halt Execution key, and it will
stop execution
of the PL/SQL routine retaining watch and breakpoint settings.
Example
to
Debug your code
Let's say that you have a procedure already created like this:
CREATE OR REPLACE PROCEDURE
case2_proc (p1 IN OUT NUMBER) AS
n NUMBER;
BEGIN
n := p1;
p1 := n + 1;
END;
/
Step 1: Load it
into
your editor.
Step 2: If
your program has an input parameter, then you
need to supply the value, unless it has a program-supplied default
value. If you are debugging a
trigger,
then you need
to supply the column values necessary for building an
INSERT/UPDATE/DELETE
statement that will in turn cause your trigger to fire.
If you do not specify the input values
beforehand, Toad will open this window automatically when you
attempt
to debug
or execute.
So (for this case) you will click the (...) parameter button
and
you
will
get
a window like thhe following. Let’s
take
a few minutes to discuss each of the
numbered areas below:

- Procedure. The program to be executed. If you have a Package Body opened, you
will see multiple
functions and procedures listed here. Select
the
one
you
want
executed/debugged. Ensure
the code seen in area 3 executes the code you want to deal with.
- Arguments. Your program may require several input
parameters. Supply the values here. You’ll see the code in area 3 updated
to
reflect the values you supply in this area.
If
you
are
working
with
a DML trigger, you’ll see a list of columns for
the affected table here. Supply
values to
help build a WHERE clause for area 3.
- Code. Toad will build an anonymous
block to
cause your program to be called. If
you
are debugging or executing a DML trigger, you’ll see an
UPDATE/INSERT/DELETE here instead of the PL/SQL call.
- Transaction
Control. At the end of the
anonymous block, Toad supplies a COMMIT or ROLLBACK command. The default is COMMIT.
This
can
be
configured
at
View > Options > Debugger > Transaction
Control. There is an option for
‘Prompt’. This will cause Toad to
ask you each time you
execute if you want to Rollback for Commit.
- Toolbar. From here you can optionally enable
the
Profiler, or capture REFCURSOR and/or Collection values for
display
after execution.
The information you supply here will be saved
for
future
executions. It should also be noted
that
the ‘Code’ section can be manually coded by the user, so you can
add
any
additional code you want here. Just
be
sure to have a call to your program so the debugger will work.
Step 3: Then you
can
set Breakpoints (optional step)
A
breakpoint
is
an
instruction
to Oracle to pause
execution when it reaches a certain line of code.
PL/SQL
is
interpreted
at
run-time. When Oracle
sees a line of code with an
attached breakpoint, it will stop execution to allow a debugger to
take
control. It should be noted that
Oracle
does not interpret every line of code as an ‘executable’ line. Only lines of code that are actually
‘executed’ will have their breakpoints honored.
Toad will tell you ahead of time, what lines you can add
breakpoints to
by placing a blue dot in the gutter.
Clicking in the gutter will add a breakpoint to the line. Clicking on it again will remove the
break
point. In the following example, I clicked on Line #7 to add a
breakpoint.

The Breakpoints Tab
The Editor has several output panels that assist with
debugging.
You will want to enable the ‘Breakpoints’ tab. You can
do
this by mouse-right-clicking on the editor output tabs and selecting
‘Desktop Panels > Breakpoints'.

The ‘Breakpoints’ tab will display the lines that have
breakpoints attached. You can add new
breakpoints here, disable existing ones, or remove them altogether. You can also optionally add breakpoint
‘conditions’. A conditional breakpoint
means that a line will only stop execution if a particular condition
is
present. Let us take a moment to dive
into this topic a bit deeper.
When
you
open
the
‘Breakpoint
Properties’
window using the ‘Edit Breakpoint’ button,
you’ll be
able to supply a condition and/or pass count.
A condition can be any expression that Oracle can evaluate. Each time this line is executed, the
expression will be evaluated first, and if it evaluates to ‘True’,
then
the
program will break. For the pass
count,
Oracle will keep track of the number of times the line has been
executed. It will only break on on a
particular execution. This is
extremely
useful when working with
LOOPs and when you want to see what happens on a particular
iteration,
e.g. the
340th time a particular line is executed.
Setting the pass count will save the time it
will take to manually step over the code 339 times.
Notes on Breakpoints:
- Breakpoints will be saved for
future
executions.
- You can manage breakpoint during
execution.
Step 4: Using
Watches
to interact with PL/SQL Variables
While
executing
your
code,
you
will probably want
to see what a particular variable is set to, or you may even want
to
change its
value artificially to step through some ‘what-if’ scenarios. You will want to activate the ‘Watches’
tab
to do this kind of work.

The ‘Watches’ tab is broken up into 3 sections:
- ‘Smart Watches.’
A
newer
feature
available
in
version 9, this panel will automatically
parse the code for all of the variables and show you their
values. This is a ‘quick-n-dirty’
look at your
variables. If you want to do
anything
other than ‘look’, you’ll need to manually add a watch.
- ‘Watches.’ These
are
the
variables
or
expressions
you want to inspect during run-time. You
can
add these by dragging and dropping
from the ‘Smart Watches’ area, or you can manually add by using
the
‘Add Watch’ toolbar button. You’ll
see
that ‘x’ is showing as ‘NULL.’ This
is
because line #7 has not actually executed yet.
If
you
were
to
step
over to the next line, ‘x’ would then show a value of
‘1234.’
- Toolbar. What
if
you
want
to
see
what happens in your code if ‘x’ were equal to
something else? You can
artificially alter
the value of ‘x’ using the debugger.
‘Edit
Watch.’
Clicking this button allows us to modify the properties of
the
watch. We’ll look at that in a
second.
‘Evaluate/Modify Watch.’
This button allows us to change the value of the variable
inside
the
execution of the program. Let’s take a
look at this in detail.
“Expression.”
–
this
is
the
value that we are inspecting with the watch.
“New Value.” – type in the new value you wan to assign to the
expression selected in area #1.
“Modify” – hit this button to send the value inputted in area #2.
“Result” – you’ll see the updated value here.
The new value will persist until the program is finished executing
or
until it changes based on a future line of code or until you
modify it
manually.
 Watch Properties
Using
the properties of a watch will allow you to
do some really cool things while debugging.
Let’s finish our discussion by looking at these advanced
features.

- ‘Expression.’
This
is
the
value
that
Toad will ‘watch’ for you. You
can
select any PL/SQL variable, or any expression of a PL/SQL
variable. You could watch ‘X’ or
‘X+100.’
- ‘Break on value change.’ Why are we debugging this code? Maybe
you
want
to
know
why your program returns a value of 5 versus 15.
Maybe
you don’t know WHERE the program is
misbehaving, but you do know that at some point, your variable
gets set
incorrectly. You can use the ‘Any
value
change’ watch break condition to tell Toad to stop execution. This will break the program based on a
variable’s value changing, versus based on a particular line
number. You could also choose a
particular condition. So, instead
of stepping through 4,000 lines of
code waiting for ‘X’ to change, you can just set a breakpoint
via the
watch and have Toad stop execution automatically when your
variable is
updated. This can be a HUGE
timesaver.
Notes on Watches:
- You can see the value of a variable
without using the ‘Watches’ tab. Just
place
your mouse cursor over the variable in the editor, and Toad will
respond by showing the value.
- Complex data types are generally
not
supported by Oracle’s debugger. For
example, if you want to watch a REFCURSOR, you will need to
declare a
local variable in your code for each attribute of the cursor you
want
to watch.
- If you do not compile with debug,
watches will not work.
Execution
Profiling
Toad allows you to record your PL/SQL execution to determine where
any
execution bottlenecks are occurring, e.g. Why is my program taking
so
long to run?‟
What do I need to do to
set
up the PL/SQL Profiler?
You first need to run Toad’s Server Side Objects Wizard which is
located under the Database – Administer menu group. This will
install 3
tables into a schema of your choice then verify that you have access
to
Oracle’s SYS.DBMS_PROFILER Package. If this Package is not
installed,
you need to do the following:
- Login to Oracle through Toad as SYS.
- Load the $ORACLE_HOME\RDBMS\ADMIN\PROFLOAD.SQL script into the
Editor.
- From the SQL Editor menu, select Execute as Script (or press
F5).
- Make sure that GRANT EXECUTE on the DBMS_PROFILE package has
been
granted to PUBLIC or to the users that will use the profiling
feature.
1- Connect at the OWNER of the Code.
2- To execute a profiler run, toggle "on" the "stopwatch"
button next to the "debug" toggle.

3- Then execute your PL/SQL program
from the Editor or execute the Procedure/Package/Function from the
Schema Browser or the Procedure Editor using the Execute (lightning
bolt) button.
You may be prompted to enter a value for your variables and a
description of the procedure being executed ("TOAD, Diego Run 1 -
12/19/2010"). This will show up in the Profile Analysis window when
you
analyze the results. You could run the procedure several times to
get
some data into the profiling tables.
4- After it is finished, pull up the record from the
"Profiler" tab ( Database /
Optimize
/ Profiler Analysis).
How do
I
view the collected data and what do I do with it?
The bottom half of the window lists the runs (called Anonymous
Block,
that is executed 3 times), Procedure, Timestamp, Comment, and Total
Time to execute. You can sort on the columns by clicking on the
column
headers.
The upper half is a graphical representation showing the percentage
of
time required to run each component of the Procedure.
Between the top half of this window and the bottom half is the
analysis
toolbar which lets you alter the graph characteristics, navigate
between the levels or open the Editor.
With version 9.6 and higher, you can now automatically
pull up the visual chart representations of your PL/SQL runs by
clicking on the "Details" button and quickly determine which line of
code is taking the most time to run. Toggle on the ‘Details’ view to
see a graphical representation

Some
notes
on Debugger
If you have OUT or IN OUT arguments in your procedure, you can elect
to
view their values during debugging in the Debug DBMS Output window.
To accomplish this, check the “Output OUT Args” check box on the
“Execute Procedure/Package/Trigger” dialog.
TOAD will automatically add DBMS_OUTPUT. Put_Line statements at the
end
of the anonymous PL/SQL block used to invoke your procedure.
Turn on the Debug DBMS Output window from the “Debug” menu, or press
CTRL + ALT + D
Execute
a stored procedure or function and display the result in TOAD
Navigate to the sp or function in schema browser and highlight it.
There is a thunder button "Execute Procedure" up there.
Click on it to bring up the dialog where you can provide input
parameters.
To see output, you need to do things.
- First, open a output window by View > DBMS Ouput.
- Second, in the execute dialog, click "Output Options" link and
check "Print OUT arguments/RETURN values to DBMS Output".
Now the result will be disaplyed in the DBMS Ouput window after you
click OK to execute the sp or function.
Debugger
A developer's best friend for figuring out why your program isn't
behaving as expected. Run your program line-by-line, by "stepping"
through the code.
- a) Set Breakpoints:
To
set execution breaks in the code leave the cursor on the line on
which
you wish the code to break and hit F5. Set conditional breaks by
double
clicking the break in the “Break and Watch view window.” Make
sure to
only add breakpoints that are "executable". These are marked by
little
blue dots in the editor gutter for each line. Non-executable
lines will
not have their breakpoints honored by Oracle.
- b) Add Watch To add a
watch on a variable, leave the cursor blinking on the variable
on which
the watch is desired and click the eyeglasses icon.
New for v9.5, you
can see the values of all of your code variables by using the
"Enable
Smart Watches" feature.

c) Modifying
Variable Values While Debugging
To artificially change the value of
one
of your PL/SQL variables,
highlight the variable in the watch window and hit the calculator
on
the icon bar which, once moused over will read “Evaluate/Modify
Watch”
Setting
breakpoints/visualizing variable contents
Breakpoints suspend the execution of the code. This allows you to
view
the contents of various variables.
You could set the breakpoint by simply clicking to the left of the
Procedure Window.
Notice that the Break Points tab at the bottom shows the line
location
of the breakpoint. To work this code, click where the breakpoint is
desired and then press the Run button. This will invoke the
debugging
routine and suspend code execution when the breakpoint is reached.
After the code is suspended, you can check the contents of variables
and implicit cursors. The line with the breakpoint set is now
highlighted in blue. Simply place the mouse cursor over a variable
or
cursor and the contents will pop up after a second or so.
Watches
A watch in TOAD allows you to watch the changes to variables as the
code is executed. You can also change the contents of a “watched”
variable. Watches are easy to set.
You can highlight the variable and
press the Add Watch button on the Watch tab (the Ins key is the TOAD
hot key).
You can also right-click on the highlighted variable and select Debug |
Add Watch at Cursor.
Any of these options will add the variable to the Watch tab.
You can also modify the value of a variable that is watched to force
a
special situation.
Conditional
breakpoints
TOAD allows for breakpoints to occur when the process has performed
certain events (such as looping x number of times) or when a certain
data condition exists.
This is easily accomplished by first setting the breakpoint. Click
to
the left of the Procedure Window, and then right-click and select Debug
| Set Breakpoint). Then, go to the Break Points tab,
highlight
the
breakpoint for which you want to define a condition, and press the
Edit
Breakpoint button (the leftmost button).
Debug
Scripts
Toad also offer you the option of Debugging Scripts. To perform this
action, you just need to load your script on the editor, for
example:
-- ri_off.sql
set pagesize 0
set feedback off
set term off
spool c:\temp\ri_off.tmp
select 'alter table
'||owner||'.'||table_name||' disable constraint
'||constraint_name||';'
from user_constraints
where constraint_type =
'R'
and status = 'ENABLED';
spool off
set term on
set feedback on
set echo on
@c:\temp\ri_off.tmp
Then from the Menu select Debug /
Script Debugger.
After that you’ll see how the editor’s toolbar icons for debugging
are
now enabled.
So now I can set a break on line 8, run the script to that point,
and
examine my variables under the Environment Section / User Variables
(near the buttom).

Update
on
Toad v10.5
Now with a simple button click, Toad will insert the output
commands for you throughout the program for all of your
expressions. So debugging can now work more like this:
- Program isn’t doing what it should be
- Have Toad add the DBMS_OUTPUT lines
- Execute your program
- Review the DBMS_OUTPUT panel
- Double-click on the offending output value, Toad will navigate
to
the appropriate line of source code
- Repeat as necessary.
- When finished, have Toad remove the DBMS_OUTPUT lines
There are 2 new toolbar buttons: "Apply Auto Debugger" and "Remove
Auto
Debugger".
When you click on the 1st one, Toad automatically adds DBMS_OUTPUT
lines for all your variables.
The code is inserted throughout your program for the following
conditions:
- each program entry point,
- each assignment,
- calls to other PLSQL excluding calls to dbms_output, and
- SELECT INTO var.
You’ll notice a new tab is available, labeled ‘Auto Debugger
XXXXXXXX’. Your native DBMS_OUTPUT code statements will
appear in
the ‘Default’ tab. The code that was added artificially via
Toad
will appear in the new ‘Auto Debugger’ tab.
As you inspect your output, you can auto-jump to the line of code
that
generated the value by double-clicking on the line.
A block is also inserted before all program exit points
including the final END and any RETURN statements.
Enhanced
Code
Refactoring
(All
Toad
Editions)
Code refactoring is the process of improving the design
of
the code without affecting its overall behavior. There are a
number of
methods for achieving this, of which Extract Procedure is one
(introduced in Toad 9.7).
In Toad v10.5, all refactoring methods are now presented from the
Editor right-click menu
and
have their own group called Refactor,
and
have
two
new
additions: Find
Unused Variables and Rename
Identifier.
Find Unused Variables locates variables which are no longer used
in
your code.
Rename Identifier will rename all occurrences of a selected
identifier
within the same scope.

So in summary these are all the options of Refactor:
Refactoring is the ability to alter code quickly and conveniently.
To
access Code Refactoring options, right-click code in the Editor and
select Refactor. Toad 10.5 includes the following refactoring
options:
- Extract
Procedure—Create
a new PL/SQL object from the selected text. The original code
(where
the selection was made) is modified to call the new procedure.
- Comment/Uncomment
Block—Turn the selected text into a comment or removes the
comment
markers if they exist.
- Find Unused
Variables—Find unused variables and identifiers in PL/SQL, and
then
jump to the occurrence in the Editor.
- Rename
Identifiers—Rename
identifiers (variables, parameters, or PL/SQL calls) for PL/SQL
in the
Editor.
SQL Editor Window
ACTION
|
KEY
|
| Windows Help File |
F1
|
| Toggle Output Window Figure |
F2
|
| Toggle Data Grid Window |
Shift + F2 |
| Find Next Occurrence |
F3 |
| Find Previous Occurrence |
Shift + F3 |
| Describe Table, View,
Procedure,
Function. Just put the cursor over the object |
F4 |
| Execute SQL as a script |
F5 |
| Toggle between SQL Editor and
Results Panel |
F6 |
| Clear All Text |
F7
|
| Recall Previous SQL Statement |
F8 |
| Display Previous / Next
Statement |
Alt + Up / Down |
| Execute Statement |
F9 |
| Set Code Execution Parameters |
Ctrl + F9 |
| Execute Current SQL statement
at
Cursor |
Shift + F9 |
| Pop-up Menu |
F10 or right-click |
| External Editor, Pass
Contents |
Ctrl + F12 |
| Execute Explain Plan on the
Current Statement |
Ctrl + E |
| Goto Line |
Ctrl + G |
| Convert Text to Lowercase |
Ctrl + L |
| Make Code Statement |
Ctrl + M |
| Recall Named SQL Statement |
Ctrl+N |
| Open a Text File |
Ctrl + O |
| Strip Code Statement |
Ctrl + P |
Columns
Drop-down (show objects owner by user)
|
Ctrl + T |
| Alias Replacement |
Shift + Ctrl + R |
| Columns Drop-Down no alias |
Shift + Ctrl + T |
| Code
Templates |
Ctrl +
Spacebar |
Converts Text to Uppercase /
Lowercase
|
Ctrl + U / L
|
| Display
Pop-up List of Matching
Table Names |
Ctrl + . |
| Redo Last Undo |
Shift + Ctrl + Z |
| In the data grid: goes to the
top / End of the record
set |
Ctrl + Home / End
|
| Cycles through the Collection
of
MDI Child
Windows |
Ctrl + Tab |
| Quick Describe anywhere in
Toad
to find objects and display their information in the
Describe Objects
window |
CTRL + D |
SQL
Editor
Shortcuts
1. If you have long
column/table names and do not like typing them out each time, then
you
can use our auto complete feature. Type in a portion of the table or
column name, for example “ow_cu”, and then press Cntrl + . (period).
Toad will automatically identify the name of the object and fill in
the
rest of the word to read “ow_customers”. If there is more than one
object that satisfies the string “ow_cu”, then Toad will bring up a
list of all the possible objects and you can select from there.
2. Everyone should
be
aware of SQL Recall Feature (F8) which brings up previously run
select
statements. If you want to quickly list old statements that you ran
minutes ago, then in the editor press Alt + Up or Down arrow key and
it
will toggle through your SQL Recall list. This saves you from
opening
up the Recall list and scrolling down to find the SQL you want. You
can
keep the focus in the editor and toggle through with this hot key.
3. If you are
constantly mistyping words in the Editor, then let Toad fix your
spelling errors automatically. Right click in the editor and select
“Editing Options”. On this new option screen click on the “Auto
Replace” button in the bottom right hand corner. Here you will see a
list of the common misspelled words our user’s experience. If there
are
words you constantly misspell, then you can add them to the list by
using the “Add” button. So, now in the editor if you mistype the
word
“select” as “seelct” … it will automatically fix itself once you hit
the spacebar.
4. If you keep the Ctrl
key pressed and click over a procedure/package name, that code will
be
opened on another TAB. If you do it over a TABLE, it will desc that
table.
SQL
Recall
Everyone should be
using SQL Recall Feature (F8) which brings up previously run select
statements. Access previously executed SQL by selecting F8. This
will
put a “Slide in slide out” SQL recall button on the left side of the
Editor. The user can filter the list by adding to “Personal SQLs” or
take it a step further by adding to “Named SQL” both of which are
found
under the SQL Editor menu option. To select Personal and Named SQL,
right click the statement and select “Change to Personal” or “Change
to
Named.”
a. Named SQL Giving your SQL Statements a name allows you to recall
your query by context versus obscure SQL you may have wrote 6 months
ago. If you spend more than 30 seconds writing a SQL statement, give
it
a name. You can now recall w/o using the F8 dialog giving you more
room
to type in the editor. Use <CNTRL>+N to popup a list of named
SQL
statements. Selecting one will put the SQL in your editor.
b. Quick Browse You can cycle through your list of previously
written
SQL statements using
<ALT>+<Up Arrow> or
<ALT>+<Down Arrow>.
You
can
do
this
on selected text to do
a limited replacement.
SQL
Function Templates
From the VIEW menu select the CODE SNIPPETS this will invoke a
sliding/dockable window displaying code templates. A drop down let‟s
us
see all of the different Function Types from which we can select
templates. Drag and drop can also be utilized from this dockable
window
Code
Templates
You can customize the pre-written code templates by right-clicking
in
the Editor and choosing “Editing Options.” From there you will
default
into the behavior portion of the Editor options. From the Language
area, choose edit, and you will see a number of templates to edit.
Select Templates to see, add and edit you templates. Toad provides
many
templates but the user can also add their own templates from here.
To
access the Templates from the Editor simultaneously press
<CTRL>
and the Space Bar. The user can also memorize the shortcut name,
type
one and hit CRTL/Space to retrieve the Template.
Code
Insight
Toad can help you write your SQL and/or PL/SQL statements. Code
Insight
(<CTRL> + <Period> from the editor) allows you to
quickly
browse and select Tables, Views, Aliases, Functions. Procedures.
Packages, Sequences, Users and Public Synonyms.
Also added in version 10 of Toad is the possibility of get
variables!!!
You need to enable this feature. In the main Toad Options window,
located under Editor | Code
Assist |
Toad Insight Objects, checking the
Expected Tokens or/and Available Variables/Parameters box will
enable
the automatic display of a list.
Code Insight can now be initiated by <CTRL><Period> (for
wild-carding) or
<CTRL><T> (to list all) or <SHIFT><TAB> (to
auto
fill).
Any child nodes of an object will be displayed when „.‟ is used
after
the insight window has been opened.
Explain
Plan
This option is very helpful to identify the access path of a SQL
Statement.
You can get the Explain Plan from the SQL Editor, the Database |
Monitor | SGA Trace Menu option (for Items in memory) or
from
the
Session Browser.
Once the plan is generated you will get a menu like this:

Another nice feature in Version 10 is that now you can select any
rectangular area within your data grid (instead of being forced to
select the whole data grid, or only certain rows). This allows you
to
copy just a portion of your data results to the clipboard and then
paste it into a spreadsheet or any other tool.
You can also show and hide columns much more easily now using a
quickselect drop-down menu at the top left of the data grid. When
you
click it, all of the columns in your data set are displayed in a
menu,
with a check box next to each column. Simply check or un-check a
column
in this menu to show or hide that column in your result set. This is
a
much quicker and easier method than in earlier versions of Toad.

Grids can be grouped by a column header by dragging the header into
the
Group By area at the top of the grid. This feature can be toggled on
and of with a right-click menu /
Appearance / Toggle Group Panel.

In addition to this information, there is also an online
video for all these features.
The right-click menu is also simpler and the ‘Save As’ feature has
been
renamed as ‘Export Dataset,’ which is more meaningful;
Split
Editor
New for v10.6!
If you are working on an extremely large block of code and want to
view/edit multiple sections simultaneously, mouse-right-click in the
editor panel and choose "Split Editor Layout.? You can use either a
"Top/Bottom" or "Left/Right" theme.
Data Subset
Wizard (Tools Menu)
This window lets you copy a portion of data from one schema to
another
while maintaining referential integrity, so that you can work with a
smaller set of data.
The wizard creates a script that will copy a specified percentage of
data beginning with all parent tables or from all tables with no
constraints. You can specify a minimum number of rows. The wizard
then
continues with tables that have foreign key constraints, the rows
copied are those whose parent rows have been copied into the parent
tables.
The wizard consists of four screens which allow you to set options
as
follows:
Screen 1: Select source and target
connections/schemas and specify
where to save the script.
Screen 2: Select Objects to create in the script.
Screen 3: Set up the commands in and around the insert statements.
Screen 4: Set up any extents or tablespaces when the wizard is set
to
create objects.
Using Auto
Replace
Toad allows easily add your own commands or give simple keystroke
access to your commonly-used coding techniques.
Auto Replace is used to correct typo’s and to save you time.
To set up this option go to Edit -> Editor Options, Click on Auto
Replace and you will see the existing Auto Replace options.
I entered
the following options:
Sf select * from
Pl DBMS_OUTPUT.PUTLINE
So if I type pl followed by the space bar, it will be changed by
DBMS_OUTPUT.PUTLINE
Project
Manager Tutorial 
Most IT professionals do not live exclusively in the Oracle
database.
Instead, they are using the power of the Oracle database to provide
information to their custom web pages, applications, batch jobs, and
much more. So someone using Toad to access the database is most
likely
also using spreadsheet, web development, word processing, and other
applications. Toad's Project Manager provides a centralized area for
the user to manage ALL of the items for a given application, task,
or a
project. This could be a collection of tables, stored procedures,
database jobs, ftp folders, web pages, documents, etc.
For example, I have a project labeled TOADSOFT. I can use the PM to
manage everything I need

Here you can see my project for managing QUEST content.
The QUEST project contains a node for the remote server where the
site
is hosted, a link to my Desktop and some files I need to frequently
edit and find easily, Oracle tables I need to update for posting the
Release Notes, URL's I need to keep an eye on, and a link to the
folder
where I keep a backup of all the web content.
I also have another project I use to manage the Beta release. I can
zip
up the files for the beta and DRAG-N-DROP the file to the Web Server
to
easily FTP the file.
How do
I
Add Something to a Project?
If you have already found your database object using Toad, you can
easily add it to your project. You can mouse-right-click on the
object
in the Schema Browser and choose 'Add to Project Manager.' You can
also
add objects from Toad's Object Search dialog. It's important to
remember that you can select MULTIPLE database objects and add them
to
a project simultaneously. If you have more than one project open,
Toad
will prompt you to choose the project you want to add the object(s)
to.
To see just how powerful the Project Manager really is, bring up the
options dialog by pushing the options button on the PM window. In
the
PM, we can configure what happens on Double-Clicks, R-Clicks|PopUps,
and Drag-N-Drops.
Project Manager works in exactly the same way as the Schema Browser.
In
particular, the right-click context menu is identical, and you get
the
same display on the right if you select an item.
You can also create a REAL Directory, and if you drag and drop a
table
name over there you’ll find an actual file with the DDL to create
that
table and all of its supporting structures
Action Palette,
Application Designer or
Automation Designer (like
a macro)
The Automation Designer in Toad is a great way to build the
equivalent
of batch files for Toad.
Open the Automation Designer window from the Utilities | Automation Designer.
A database developer or database business analyst might need to do
something in Toad related to the data content, and then repeat or
schedule that task, instead of doing over and over again, you can
use
the Automation Designer. The Automation Designer feature allows Toad
users to create
“mini-applications” within the Automation Designer, and schedule
these
tasks. It also enables you to run applications and scripts against
multiple connections with one stroke.
In Automation Designer, you can now right-click an application and
choose “Run with connections…” to bring up a connection box where
you
can specify which connections you want the app to run against.
These powerful features will provide huge time savings for data
professionals who need to run the same executions in multiple
databases
at the same time.
The Automation Designer is broken into three main areas:
- A. The Detailed Navigation
pane (Left,
upper
side).
When
you
have selected Apps in Area C, this pane collects
ToadApps and actions into categories. You can drag and drop apps
between categories, and actions between apps.
- B. The Display pane
(Right Side) This area displays any item selected in the
navigation
pane. If an app is selected, you can drag and drop to change the
order
of actions. Drag and drop an applicable action(A) onto another
action(B) and it will become a child of action(B).
- C. Main Navigation pane
(left lower side).Select the button that best describes what you
want
to do:
- Apps - Organize,
create and run actions and apps from this section. Apps relate
directly
to action sets from Toad for Oracle 9.6.
- Execution Log -
lists
of actions that have been executed and the status of the
execution.
- Scheduled Items -
view
actions and apps that you have scheduled using Toad or the
Windows Task
Manager.
- Search - Find an
action or an app within the Automation Designer.
As an example:
I open Toad Editor, enter my query, and press Execute to make sure it works
as
intended. Then I right-click
anywhere on the data grid and choose Save
As from the context menu. On the Save as screen, I choose
my
options and parameters and click OK
to
verify
that
it
works
correctly. Then I reopen the Save
As dialog; this time I click
the camera icon at the bottom .
A window opens which asks you for the new name of the Toad App you
wish
to save your task to (or an existing one if you have one) and the
name
of the Action itself.
.
A window opens which asks you for the new name of the Toad App you
wish
to save your task to (or an existing one if you have one) and the
name
of the Action itself.
I can now choose to run or schedule that application. If I choose to
run it, Toad is simply executing the application within my currently
running instance of Toad. That is, behind the scenes, it will
execute
the query and perform a Save As, but I won’t see anything flash by;
I’ll just see a run status indicator such as the green Completed
bar.
I can schedule that task to be performed periodically.
So where can you do this? Basically on any screen that has the
camera
icon at the bottom, like: Compare Schemas, Compare Databases, FTP,
DB
Health Check, email, TNS Ping and many others.
Another example:
Most of the users love to use the “Save As” function in the right
click
menu for the data grid. But sometimes the user has to run the same
query numerous times and repeat the steps to save the data off to
the
file format of their choice, that is a good example of using the
Action
Palette.
Run the query in the Editor. And then right click on
the
data results and select “Save As”.
Continue to select your file
format,
and
any
options
you
want. Also remember to set
a
destination location for the new file.
Once completed, on the top right
hand
corner of this window, click the little yellow lightening bolt
icon.
This will prompt you to give this action a name. Please provide a meaningful name and
hit OK.
Under the View Menu, select
the Action Palette option.
This will bring up the Toad Action window.
Located in this window will be the new Action you just created. On
the
top of this window will be a “Schedule” icon underneath the green
triangle icon.
Click on this and you can schedule the data extraction.
Just keep in mind that this is using Windows Task Scheduling to
setup
the job and you must have Windows up and logged in. You do not need
to
have Toad running in order for this to work. Now sit back and enjoy,
while Toad automatically exports data for you to your desired
location
and in your desired file format.
Good information over here:
http://toadsoft.com/oravids/IntroductionToActions.htm
http://toadsoft.com/oravids/ActionsFromToadFeatures.htm
http://toadsoft.com/oravids/SharingAndSchedulingActions.htm
Automation Designer allows you to save tasks you would normally
perform
interactively in Toad, from saving data to a file, comparing 2
schemas
to running a database health check and simply selecting them, when
the
time comes, and executing them on-the-fly. For more information on
this
feature, please refer to this
article published on Toad World.
In Toad 10, you now have the capability to executed these tasks (or
what we call Actions) or groups of tasks saved as a sequential
workflow
(or what we call Action Sets) against multiple database connections
simultaneously.

Here, you can see an Action Set in the right panel with a
selection
of tasks which can be executed sequentially, such as Export DDL,
Schema
reports, script execution, etc.
If I right-click an App (Action Set), I can select which
database
connections I want to run these tasks against. The Connections
window
opens and I can multi-select which ones to use. I can even call
Toad
from the command line and execute Action Sets remotely or
programmatically.
Action
Console
What is the action console? Simply put, anywhere you see or work
with
an Oracle object in Toad, simply do a mouse-right click on it and
the
Action Console will give you Toad's FULL arsenal of action items for
that object. ALL the power of Toad in a simple RightClick: Add
Column,
Constraint, Indexes, Analyze Object, Truncate and many more!!!

Object and
Schema Compare
Perhaps one of the most popular Toad features for developers and
DBAs
is Schema Compare and Sync.
With the DB Admin Module, you can also use schema definition files
and
perform synchronizations.
Schema Compare & Sync have been made actionable, and are
available
from the Automation Designer, or from the Window Snapshot button.
There are two ways to perform a Schema Compare using Toad:
1. Using information stored in the Oracle Data
Dictionary
2. Using native Toad Schema Definition files.
The first method uses “brute force” to obtain the DDL information
pertaining to every object in each compared schema.
The second method uses what are called Schema Definition (or schema
snapshot) files. These files are encrypted, compressed files which
contain all the information about every object in a schema at a
particular point-in-time. The real beauty of using these files is
that,
not only are they an accurate record of what a schema looks like at
a
particular point-in-time, but when used to perform a schema compare
using Toad, they take a fraction of the amount of time to process.
What
would take minutes to process using a data dictionary compare only
takes seconds using this method.
In addition, Schema Compare has been expanded for easier use. You
can
now add multiple target schemas to compare, while still being able
to
switch between two schemas. In addition, you can use either a live
connection to a database which loads all DDL information as you go,
or
schema definition files. These files are encrypted, compressed files
containing all the information about every object in a schema at a
particular point in time. You may want to use a schema definition
file
to run a time-sensitive comparison, but something additional is that
when they are used for a schema compare, they take much less time to
process.
Statspack and AWR Browser
The Toad StatsPack Browser (DBA module required) takes beginning and
ending snapshots of database performance statistics and then offers
graphical trending and time-series analyses based on those stats.
The
result is a gallery of useful charts for interpreting database
performance.
 +
+

It also contains advisories.
When two snapshots are selected (not checked, but selected), the
Advice
tab will give some info about the top wait event during the selected
interval. Another way to display the advice is to double-click blue
underlined waits in the top waits grid.

Data Import
and Export
One of the most common development and test database tasks is to
refresh data for users to run their code against. For this, many
developers use the Oracle import and export utilities. But you
really
cannot see into a dump file, other than to ask for a table of
contents.
Toad solves this problem with the Export File Browser, which is
available by selecting Database |
Export | Export File Browser.
Once you oopen your dmp file, I can view the contents of the dump
file
via the navigator tree view on the left side. I can also see the DDL
for that object and its data under the tabs on the right side as
well,
so I can cut and paste the DDL to make sure the objects exist before
the import.
Another handy tip: I can also see the data in a standard Toad data
grid. This means I get all my right-click menu options such as Save
As,
Print, and Row Count.
Note that the Export File Browser must access the dump file to
perform
its job, so the file must reside on your PC (remember, Toad has a
built-in FTP tool).
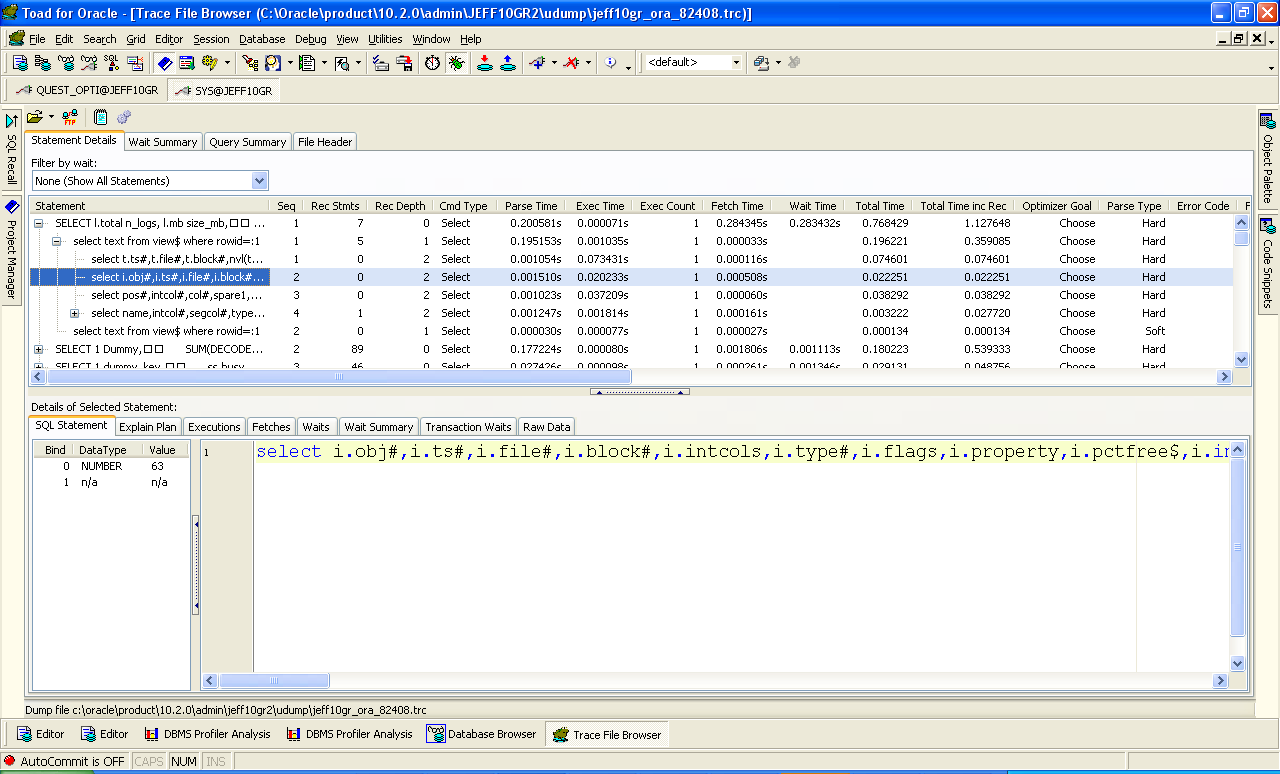
Trace File
Browser
Oracle trace files have historically been difficult to examine, you
needed to be an "expert" on TKPROF.
The
Trace File Browser provides a way to display this information in a
manner that is easy to read and easy to navigate so that problem
areas
can be quickly isolated.
The new Trace File Browser (under Database
| Diagnose | Trace File Browser) provides far more
information
than was previously possible. In addition, after you have browsed a
Trace File, a Benchmark Factory project file can be pushed to
Benchmark
Factory for workload replay.
As of version 9.7, you can now visually inspect the contents of your
Trace files. See immediately all of the queries captured with their
binds, waits, and performance profiles.

Code Expert
What if you’re a DBA trying to track down a performance problem
somewhere in the millions of lines of PL/SQL code in your database?
Toad has a batch mode interface in Code Xpert designed for that very
purpose. It scans the code and highlights line that needs
attention—finding the proverbial needle in the haystack for you.
Just Select Database | Diagnose |
Code Expert , Load your objects, select the ones that you
want
to Review and you are ready to go
Click on a query to see the binds variables and the values passed
for
execution.

Toad will show the number of queries that run under specific amounts
of
time. Drill down to an individual statement to see the Execution vs
Parse vs Fetch vs Wait times so you know EXACTLY how to approach a
tuning scenario.
Database Browser
You can access this Mudule by selecting from the Menu: Database > Monitor > Database
Browser
There have been some major enhancements to the Database Browser. You
can now use it as a central point for your database administration.
As
before, you can navigate to every database simultaneously, and drill
down into any of them to administer database and schema objects.
Now you can right-click on a database node and perform a number of
additional administration operations. You can go directly to the:
* Top Session Browser for the selected database.
* Session Browser for the selected database.
* DB Health Check on the selected database.
* AWR Browser
* Generate RMAN Scripts
* And many more...

RMAN Script Templates
Oracle RMAN scripts can be challenging and time consuming,
especially
for less experienced DBAs and they wanted an easier way to create
and
maintain scripts. Toad 9.7 supplies basic scripts that can be
copied,
edited and stored for re-use. Also, Toad variables can be embedded
into
the RMAN script.
You can edit existing RMAN scripts and add and delete scripts to and
from the scripts list from the Options
|
RMAN
Templates page.
You can then generate RMAN scripts from the Database Browser.
1. From the Database Browser, select the database where
you want to execute the script.
2. Right-click and select Generate RMAN Script and
select
the script you want to generate
3. Enter any required variables and click OK. The
script
will open in the Editor window, where you can then save or execute
it
via F9. Executing will open and run RMAN outside of Toad, and then
close independently.

Since Toad 9.7 the Database Browser has an addition menu named
“Generate RMAN Script”. From this menu you can call several
predefined
scripts and you can add your own scripts as necessary.
The “Basic Script to setup RMAN for backups“ allows you to set the
configuration parameters.
Calling this script opens an additional parameter window to set or
change some basic variables like log file location, backup location,
etc.
Data Generator
Data generation is implemented in the following locations:
* Schema Browser Left Hand Side (Object Panel) -
right-click and select Generate Data.
* ER Diagram - Click the Data Generation button:
* Create Table window- Click the Generate Data
tab.
In particular, you can specify:
* The number of records to create
* How to handle constraints
* How to handle Referential Integrity
* How to commit your work
You can use Toad to generate test data for your database. You can
generate data for multiple tables at one time or for single tables.
This feature is a Toad Action, which means that you can save it and
schedule to run. Toad now has built-in generators that let you
quickly
add test data to common fields like business names, addresses and
personal information like first and last names.
You can also select from your own random data, through either a
constant list or a custom Select statement. You can specify a
foreign
key column in a reference table to simulate data that’s linked to
another table.
Finally, Toad now gives you the option to select a custom procedure
called TOAD_DATAGEN, in which you can create very specific
instructions
for generating your data.
You can access to this option with a simple right click over a table and
select
"Generate Data". You can
also
use the Menu "Database | Import |
Generate Data".

There are several Options to consider here:
Random Data Engine
- Internal= Creates a script with "n" INSERT statements per
table
(depending on the individual table's settings). An option is
also
available to commit every "x" rows. This is the most basic data
generation option, but it does not require you to install any
packages
on the database server. Note: This will create a very large SQL
script,
which will take longer to execute.
- DBMS_RANDOM = Uses Oracle's DBMS_RANDOM package to generate
data.
The package can generate Unicode data. It must be installed on
the
database server for this option to be available.
- TOAD_DATAGEN= Uses Toad's package to generate data on the
server.
This option generates a much smaller SQL script, performs
faster, and
supports real-life data sets.Note: You will need to install the
TOAD_DATAGEN package through Server
Side Object Wizard in order to use this feature. This package
can be
installed locally, or in the global Toad schema. See Install
Server-Side Objects for more information.
Transaction Commit mode
Select an option to specify the commit action to take after each
table.
DDL statements, such as TRUNCATE TABLE, DISABLE/ENABLE CONSTRAINT,
AND
DISABLE/ENABLE TRIGGER, automatically apply an implicit COMMIT
against
the database. This option specifies what level of commit to take
between actual data generation blocks.
Allow Reproducible
Sequences
Select this option to use a hard-coded random seed, allowing the
script
to reproduce the same sequence of data on multiple Oracle servers.
By
default, the data generation window initializes its random generator
using the system timer from gv$timer.
| General
Options |
Description
|
| Random
Data Engine |
Select
one of the
following:
-
Internal—Creates a script with "n" INSERT statements
per
table (depending on the individual table's settings).
An option is also
available to commit every "x" rows. This is the most
basic data
generation option, but it does not require you to
install any packages
on the database server.
Note: This will create a very
large
SQL script, which will take longer to execute.
- DBMS_RANDOM—Uses Oracle's
DBMS_RANDOM package to generate data. The package
can generate
Unicode data. It must be installed on the database
server for this
option to be available.
-
TOAD_DATAGEN—Uses Toad's package to generate data on
the
server. This option generates a much smaller SQL
script, performs
faster, and supports real-life data sets.
Note: You will need to install
the
TOAD_DATAGEN package through Server Side Object Wizard
in order to use
this feature. This package can be installed locally,
or in the global
Toad schema.
|
| Transaction
Commit
mode |
Select an option to specify the commit action to take
after
each table. DDL statements, such as TRUNCATE TABLE,
DISABLE/ENABLE
CONSTRAINT, AND DISABLE/ENABLE TRIGGER, automatically
apply an implicit
COMMIT against the database. This option specifies what
level of commit
to take between actual data generation blocks.
|
|
Allow Reproducible Sequences
|
Select this option to use a hard-coded random seed,
allowing
the script to reproduce the same sequence of data on
multiple Oracle
servers. By default, the data generation window
initializes its random
generator using the system timer from gv$timer.
|
|
Enforce Referential Integrity
|
When selected, Toad creates data where all foreign keys
in a
details table contain only appropriate values found in the
referenced
table.
Note: This
option
can significantly increase execution time because Toad
must query every
row of the reference table for each entry in the details
table. Because
of this, you may want to schedule this task at a later
time so as not
to tie up system resources.
|
| Constraints |
Description |
|
Disable Constraints before Data Generation
|
When selected, Toad will disable all constraints
(primary/foreign keys, unique, or check) on the selected
table before
generating data. If you also wish to maintain foreign keys
while
generating data, also select Enforce Referential
Integrity.
|
|
Enable Constraints after Data Generation
|
When selected, Toad will enable all constraints
(primary/foreign keys, unique, or check) on the selected
table after
generating data.
Note: This
step
may produce an error on Primary/Unique keys if duplicate
data was
generated in the table.
|
| Triggers |
Description
|
|
Disable Triggers before Data
Generation
|
Disables any triggers associated with this table. This
can be
useful when a trigger is associated with an INSERT event
that does
additional work to the selected table, or other table in
the database.
By disabling these triggers, you ensure they will not be
executed every
time a record is appended during data generation.
|
|
Enable Triggers after Data
Generation
|
Select to enable all triggers associated with this table
after
data generation has completed. Doing this ensures that
these triggers
fire for subsequent insert or update statements.
|
|
Note: The
General
Options
node
applies
to
all tables selected in the Generate
Data window.
|
An online
video tutorial is also available for this feature
Rebuild
Multiple Objects
In TOAD you have an option to move several objects to other
tablespaces. It's as simple as:

An then Select the objects that you want to move
SGA Trace
Optimization
You can use the SGA Trace / Optimization command to view information
about SQL statements that have been executed and the resources they
used. Whereas Auto Trace and TKPROF information is specific to a
single
statement, SGA Trace Optimization displays statistics from multiple
SQL
statements currently present in Oracle's SGA (System Global Area).
Go to Database -> Monitor ->
SGA Trace Optimization to open the SGA Trace window. You
can set
several options from this screen in order to search for SQL
statements.
The default settings are for ALL Statements for ALL Users, but you
can
click on the corresponding drop-down box and choose another option
to
change these choices. You can limit the selection to a single
statement
type (e.g., SELECT statements, UPDATE statements, anonymous PL/SQL,
etc.) or to a specific user. You can also enter a text string in the
SQL Search Text box to limit the rows returned to statements
containing
that text string.
Click on the "Refresh the List of Statements" button to retrieve the
most resource-intensive SQL from the SGA. This returns all of the
queries that match your criteria. The screen is divided into two
parts:
* The query results grid on the top half of the
screen shows the query that was executed and the associated
resources
used (memory, disk reads, loads, etc.).
* The bottom half of the screen displays the full
SQL statement, execution statistics from the Oracle shared pool, and
the Explain Plan for the query.
When necessary, you can pass a SQL statement into the SQL Editor
from
the SGA Trace window. Highlight the desired statement, then click on
the "Load selected statement in a SQL Editor" button on the SGA
Trace
toolbar.
This toolbar also contains a button to "Flush the SGA." Your Oracle
privileges dictate your logged-in user's ability to use this
function.
NOTE: SGA Trace Optimization requires access to a
number of Oracle V$ objects.
So how do you utilize this information?
If you primary interest is simply finding highly shared SQL
statements
(i.e. those that get executed by many sessions), the main data grid
has
columns for “Users Opening” and “Users Executing”. You also can look
at
the “Sessions” tab contents for the statement to see the details of
all
those sessions accessing that shared SQL statement. However if your
key
interest is to tune those statements (once found), then the “SQL”
tab
offers toolbar icons to send the chosen SQL statement either to the
Toad Editor or SQL Optimizer for manual or automatic tuning,
respectively.
Remember, tuning those statements which get called the most either
by a
single session or collectively by many sessions will yield the
greatest
return on investment. If you can make a statement 2% faster and it
gets
called thousands of times per day (even if by different users), than
the net effect will be highly positive.
Tuning SQL
(Optimize SQL)
Wherever you encounter SQL in Toad, you can also invoke a tuning
session for that statement by simply pressing the “Optimize SQL”
button.
Tuning Current Statement from the Editor
When handling a problematic SQL statement in the Editor in Toad, it
is
very easy to move the statement into our tuning lab. Just select the
SQL you want to tune, and hit the "Optimize SQL" button. Again, it
is
the Yellow Beaker with the Tuning fork (Found on the right of the
printer button.). You will then be prompted to send the SQL code to
the
Tuning Lab or the Batch Optimizer. I recommend you become
comfortable
with the Optimize SQL which allows you to manually tune a query
before
you use the automatic Batch Optimize technology.
Optimize
SQL
The Tuning Lab, or the "classic Tuning window", guides the user
through
analyzing the current execution plan and then to generating SQL
query
rewrites that will hopefully find a different execution plan that
positively affects the execution time. Toad can generate and
evaluate
the theoretical execution plan.

The SQL Information tab under the plan will let you know if there
are
any problems with your plan that could affect performance.
You can view the plan in several different formats and even get
detailed documentation for each plan step – all by
mouse-right-clicking!
Ready
to
tune?
With your statement in the "Optimize SQL" window and "SQL Details"
panel, you have several options:
- Optimize – ideal for fast running queries, this will
automatically re-write the SQL and execute each unique execution
plan.
You will be notified as soon as a faster alternative has been
identified.
- Rewrite – ideal for long running queries, this will JUST
rewrite
the SQL statement and allow you to evaluate each unique plan
that has
been identified. You can then decide which queries you want to
test by
executing them.
- Index – ideal for product and application environments where
the
SQL statements are not available for rewrites. This will
generate
virtual indexes and allow you to see the new execution plans
available
before you physically create the index. If you test these
scenarios,
the indexes will be created and the original queries executed to
verify
the performance has improved.
- Rewrite & Index – Does both rewrites and index scenarios.

As each scenario is executed, they are ranked by Elapsed Time. You
can
cancel execution at any time, or let it continue through all of the
rewrites for a more exhaustive set of scenarios.
You can easily compare any two scenarios by seeing both the SQL
syntax
and execution plan differences side-by-side.
Advise
Indexes
The indexing feature will analyze a collection of SQL statements to
see
which tables and views are being queries, and then will look at the
existing set of indexes. It will then generate a list of alternative
indexes you can evaluate for optimal execution of your original SQL
statements. We recommend the SQL Query re-write tuning methodology
whenever possible as adding indexes to your system can affect the
performance of other SQL queries found in your code and views. If
you
need to create a new index, then be sure to use our Impact Analysis
technology.

Analyze
Impact
Whenever you add one or more indexes to the database, the execution
plans for your applications‟ embedded SQL can be dramatically
impacted.
The Impact Analyzer allows you to model these proposed system
changes
so you can see exactly how your new index affects everything else in
the database. We generate the new theoretical index and the new
execution plans for each of your production SQL statements. You can
see
what the before and after ramifications are to your system whenever
you
propose a change.
Identify key SQL code, propose a change to the system (a new
index?),
then see how that change affects the execution plans for your SQL
code.

Batch
Optimizer
The tuning technology now allows a user to send multiple tuning jobs
(any collection of SQL or any embedded SQL found in a set of PL/SQL
programs) to a tuning queue. Each section of code will be evaluated.
Any "problematic" SQL code will be automatically tuned. You will be
informed what SQL the tuner was able to generate that will allow
your
query to run faster, and by how much!

Tuning
Lab
The Tuning Lab, or the "classic Tuning window", guides the user
through
analyzing the current execution plan and then to generating SQL
query
rewrites that will hopefully find a different execution plan that
positively affects the execution time. Toad offers an
easy-to-understand execution plan which is automatically generated
when
a statement is moved into the Tuning area.

Toad takes selected tuning techniques like syntax transformation,
hints, where clause order permutations, etc to generate new queries
that force Oracle to consider new execution plans for your queries.
- Explain Plan- Toad
offers
an easy-to-understand execution plan which is automatically
generated
when a statement is moved into the Tuning area. The Explain Plan
displays a numbered layout to show the order of operations. An
English
breakdown as to what each step of the explain means can be found
right
below the plan itself. This simplified execution plan is now
offered
directly in the Toad editor.
- Optimize - This is the
“make it go faster” button. It is an icon represented by a blue
tuning
fork in the top left of the tuning window. This will rewrite the
statement in as ways that generate a unique execution plans.
- Execute – This button
will run the selected query re-writes so we can see which one
runs the
fastest as compared to the original statement.
- Resolution – After the
re-writes are finished executing, click on the „Resolution‟ tab
to see
the „winning‟ query re-write.
New for
10.5 , Optimize Current SQL
While in the Toad editor, you can now invoke a tuning session to run
inside of Toad for the current SQL statement. This interface will
automatically generate alternatives and execute them, alerting you
to
alternatives that generate faster execution times. This is ideal for
tuning scenarios involving queries that run in terms of minutes or
seconds versus hours.
If you are looking for an interactive tuning environment where you
have
more control, you should continue to use the Quest SQL Optimizer
interface. However, if you are new to tuning SQL, then this feature
is
much simpler and is definitely worth a look.
When launching a tuning session inside of Toad, you'll be asked to
choose between a OLTP or Data Warehouse environment, a' Search
Depth'
which determines the number of re-write alternatives to investigate,
and provide an optional time limit for the re-write and execution
exercise.
New for
v10.6, Plan Control
It is not always possible to implement a query re-write, especially
in
production, to solve a performance problem. Oracle has introduced a
new
query performance management feature in 11g to address this, known
as
SQL Plan Baselines.
With a touch of a single button, Toad was able to evaluate 60
different
plans. After testing them, it identified one that took the response
time from 43 seconds down to 6 seconds! We can now deploy this to
the
database without making any changes to the application source or
worrying about introducing any SCHEMA changes that could affect
other
parts of the application (like an INDEX).
Run
Toad off a USB Flash
Drive
Here are the steps:
1. Format the USB Flash Drive as an NTFS file system.
a. File explorer, right hand mouse, properties, hardware tab
b. Select the USB Flash Drive and press the properties button
c. Policies tab, choose Optimize for Performance and press OK
d. Format the USB Flash Drive – NTFS should now be available
2. Create TOAD_FLASH directory on your USB Flash Disk (at topmost
level)
3. Download and then unzip the TOAD_FLASH.zip file onto your USB
Flash
Disk
4. Unzip the contained Oracle Instant Client installation file onto
your USB Flash Disk
5. Install Toad for Oracle and copy the Toad home (install
directory)
to your flash drive
Example: xcopy /s /q "C:\Program Files\Quest Software\Toad 9.7"
"X:\Toad 9.7\"
6. Run TOAD_FLASH_SETUP.bat file to install (and save pre-existing
Toad
setups)
7. Run TOAD_FLASH_RUN.bat file to launch Toad (must enter license
first
time)
8. Run TOAD_FLASH_RESTORE.bat file to restore PC back to prior Toad
state
You can download the file at http://www.bertscalzo.com/Files/TOAD_FLASH.zip
ER Diagram
The new ER Diagram for Toad v10 provides far more capabilities than
its
predecessor, particularly when it comes to graphical manipulation
and
reporting.
You can call the ER Diagram from Database/
Report
/
ER
Diagram. You can also right click the table name in
Schema Browser and select ER Diagram.
There are a number of ways to include or add schema objects into the
ER
Diagram:
- Right-click table in Schema Browser (defaults to five
referential
levels)
- Use the Add Object button in ER Diagram
- Drag and drop from Schema Browser
- Drag and drop from the Object Palette
- Drag and drop from Project Manager
Diagrams can be exported into .bmp, .png and .jpeg formats and
reports
can be generated in HTML or RTF formats. The HTML diagram is
hyperlinked, allowing you to view object details simply by clicking
on
the object in the diagram. Reports can be automatically zipped and
added as an e-mail attachment by opening your Windows Outlook
client.
As always, if you also have a copy of Toad Data Modeler (TDM), you
can
reverse-engineer schema objects in the Toad ER Diagram to create a
complete physical data model in TDM.
The reverse-engineering functionality in ER Diagram is very nice.
You
can select the tables that you want to bring into the model, and it
automatically selects the tables that are related (up to five levels
deep).
The final imported layout is a nice ER diagram in either IE or
IDEF1X
format.
What really puts ER Diagram above the other diagramming tools;
however,
is its focus on being an exploration tool as opposed to an
architecting
tool. For example, if you hover over any relationship line, Toad
highlights the columns in the two tables that make up the
relationship.
Also, if you double-click on any entity or on any relationship, the
details of that table or constraint will pop up in familiar Toad
format. What Toad has done here is merge the schema browsing
functionality with the ER diagramming functionality to take data
schema
exploration to a completely new level.
When you first open the ER Diagram, an empty diagram is created. You
need to click on the Add Objects (+) button on the toolbar to add
objects.
You can also drag Tables to the Workspace from the Object Palette,
Schema Browser, Query Builder or Project Manager. of course you can
zoom in / out like with any other tool. You also have the Loupe
button
that will show you all the details in the left button section of
your
screen.
You can also perform your favorite actions if you right click over
an
object or if you double click on it.
Options that include Zoom, Pan, Loupe and Fit-to-View are all
available
for maximum flexibility in working with large schemas. In addition,
a
grid can be displayed with objects being snapped to grid or objects
aligned to each other to enable excellent close-up work as well.
There
is also an Autolayout button. You can also select some objects,
rigth
click and select "Add to Workspace" to move those objects to a new
Window.
Notes and a Title block can be added for additional documentation;
there is even a Category feature which allows different groups of
objects to be given a unique color.
For printing purposes, multiple formats are supported up to A3 size
and
there is a fit-to-page feature.
Workspaces allow specific parts of a complex schema layout to be
drawn
separately if convenient, but the connections to the main diagram
remain.
In summary, you can perform the following actions:
- Use the Zoom and Snap
to
Grid features to organize your diagram.
- Create detailed
reports
in several formats, zip, and email them.
- Export diagrams to
several different graphics files (bmp, jpeg, png)
- With the appropriate
Toad
Edition, you can also create random test data for selected
objects.
- Create a diagram and
send
it to Toad Data Modeler for detailed modeling.
- Generate Data for
those
objects
- Create Scripts for
those
Objects
- Generate an HTML or
RTF
(Word) Report
If you need to alter models and push migration DDL scripts or
compare
models, you will need to use Toad Data Modeler, which is free to use
for all licensed users of Toad for Oracle who are also current on
maintenance. The diagrams are generated by reading the foreign key
constraints defined in the database.
Hot Tip: If you have a
database that does not use foreign keys, then you can use Toad Data
Modeler to reverse engineer a schema and use the ‘Infer
Relationships’
feature to guess relationships based on common column names between
tables.
There is a great Video Tutorial HERE.
SQL
Auto-Optimization or SQL
Optimizer(Toad Xpert
Edition)
The Quest SQL Optimizer for Oracle, which is a component of the Toad
Xpert Edition (and higher) is designed to address to optimize your
code
and provides an array of technologies to discover where the problem
is
happening in the application and to simply and effectively resolve
that
problem - either through a SQL re-write or by recommending the
appropriate index(s).
With the SQL statement visible in the Editor, you merely select the
SQL Optimizer drop-down and
click Optimize Current SQL
to invoke.
This option is in the 12th position, near the printer icon.
 Optimize Current SQL will
initiate
an optimization task based on the caret position of the SQL
statement
in the Editor (where you have more than one)
Optimize Current SQL will
initiate
an optimization task based on the caret position of the SQL
statement
in the Editor (where you have more than one)

This Auto Optimize functionality will look for as many
alternative
rewrites as you want based on database type and search depth. The
deeper the search depth the more re-writes, but the longer it will
take. It will then show you which alternative was the best in
terms of
Elapsed Time (or any other metric you select from the drop-down).
You can compare the best (or any other) SQL alternative
side-by-side with the original SQL to reveal the SQL, Explain Plan
and
Execution Statistics. If you decide at this point, you want to
launch
the full SQL Optimizer and investigate index alternatives, etc,
the SQL
Optimizer button is right there.
Database Monitor
(from Database/ Monitor
Menu)
Health check isn’t the only thing that’s been updated for the DBAs;
Toad also has a very nice collection of enhancements that work
together
for much better database monitoring.
Until now, the best way to monitor what is happening in your
database
was to use Quest’s Spotlight tool. As a result, DBAs tend to launch
Spotlight and run it continuously to keep an eye on things.
Unfortunately, Spotlight was not built to work this way. Spotlight
is a
diagnostic tool, not a monitoring tool; it’s great for trying to
troubleshoot problems in the database once you’re aware of them, but
using it as a constant monitor will place an unnecessary strain on
your
servers.
The "correct" monitoring tool is Toad’s DB Monitor. In version 10,
the
DB Monitor acts as more of a background process, and integrates with
Spotlight by way of an alerting function.
With Toad 10, you can now set DB Monitor to run for as long as the
session is active, even when the tool is not open. Now that you have
a
background process watching things, you can leverage the alerting
functionality of DB Monitor. You can specify in your DB Monitor
options
that when certain thresholds are reached in your database, you
receive
a notification in your system tray.
For example, you can have DB Monitor watch the I/O activity (both
logical and physical) on your database while you and your team are
trying to develop a solution. Since you’re in development mode, you
know that there shouldn’t be very much activity in the database.
With
alerting in place, Toad can signal you when it notices that your
database is doing an unusual amount of consistent reads.
The monitoring is all done in the background, so you can set it and
forget it. You can be busy developing and a notification will pop up
from your tray icon telling you that consistent reads in your
database
are higher than expected.
From that tray icon, you can launch Spotlight to dig deeper into
what’s
going on. Now you’re using Spotlight in the way it was intended to
be
used, which will relieve a lot of stress on your server.
In summary:
- The DB Monitor tray
icon
now flashes red if there is an issue that can better be
addressed from
Spotlight for Oracle. Right-click on the tray icon to launch
Spotlight,
or choose to open the DB Monitor. An online
video
tutorial is also available for this feature.
- Alert options have
been
moved from the main Options window to the Database Monitor
screen.
- You can now run any
action (including scripts) when a specified threshold is hit.
- You can configure the
monitor to begin collecting data whenever a connection is made.
Then,
when the window is opened, all data is displayed.
- Wait events chart has
been expanded and updated for Oracle 10g and 11g.

Script Manager
For heavy duty database processing, the Toad Script Manager is the
tool
to use. This tool allows you to easily organize all your SQL scripts
into one place.
I know that’s why you have file directories, but Toad makes things a
little more functional for you. In Script Manager, you can group
your
scripts together by common purpose, and catalog them with a
description. Then when you need to run any script, it’s as easy as a
right-click. When you need to run a whole batch of scripts in
succession, it’s as easy as clicking a button.
It also enables you to run applications and scripts against multiple
connections with one stroke.
Script Manager has multiple connection functionality built into the
interface. Simply add connections to the connections panel, and when
you execute a script, it will be executed against all the
connections
you specified. These powerful features will provide huge time
savings
for data professionals who need to run the same executions in
multiple
databases at the same time.
Here’s what the new Script Manager window looks like.

The “Connections to use” panel is new. It will be pre-populated
with any currently active connections, but you can also use the
Add
button to select additional ones from the main Connections window.
You then highlight the scripts you wish to execute (the same
way
you did before) and click the execute button. This lets you
execute
scripts in this window, the Editor or the Quest ScriptRunner tool.
The
outputs from each script run will appear in a tabbed region in the
Output tab reading from left to right. See below.

There is also an options button which lets you select the
Editor
as the default. A separate Editor window will open for each
connection.
Also notice the “On File Menu” column in the lower data grid
in
the previous and following screen shots. Whatever scripts you
check
here will appear in the following three places in Toad:
The Script Manager button (down arrow):

- Project Manager (via the connections tab)
- Database Browser (right click a database instance)
Search
Functionality
Search Functionality
- A quick search
bar
has been added to the main toolbar. From this toolbar you can:
- Search Toad World
online
- Search Toad World
and other Toad-related sites
- Search AskToad
(the
Toad wiki)
- Search Knowledge
Xpert
- Perform keyword
searches against the Toad help file.

- You can enable/disable
the search bar by right-clicking on the toolbar and selecting
"Online
Search".
- You may need to
restore
the toolbar defaults to have it display initially. To do this,
right-click on the main toolbar and select Restore defaults.
Coad
Road Map
Similar to an ER Diagram, but from a
Trigger/Procedure/Function/Package
(PL/SQL) perspective, the Code Road Map parses an object's source
code
and identifies the other Oracle objects it is dependent on.
If a view calls from 6 different tables, then Toad can diagram that.
Or, if your PL/SQL function makes a package call which is dependent
on
a table and sequence, then it will diagram that.
Choose your Trigger/Procedure/Function/Package in the Schema Browser
and right-click -> “Code Road Map.” An ER Diagram will be
generated
with details about the Objects used by that PL/SQL Code.

The reporting for Code Road Maps is identical to ER Diagrams.
Note you can also use the Create Script
button (last one on the 3rd row) to generate a DDL script to build a
test or dev sandbox environment where everything to compile and
execute
your PL/SQL is available, saving you the need to copy an entire
Schema
to test a single object.
You can also use the Code Road Map to build a diagram for your
Views.
Other Good Tools
- Data Export and Import (from Database Menu)
- Object and Schema Compares (from Database/Compare Menu)
- Find Duplicates (from Database/Compare Menu)
- Master/Detail Browser (from Database/Report Menu)
- HTML Schema Doc (from Database/Report Menu)
- Dependencies (from Database/Report Menu)
- Project Manager (from View Menu)
- TOAD FTP (from Utilities Menu)
- Network Utilities (from Utilities Menu)
- Task Scheduler (from Utilities Menu)
- Compare Files (from Utilities Menu)
- SQL Loader wizard (from Database/Import Menu)
- Top Session Monitor (from Database/ Monitor Menu)
- Session Browser (from Database/ Monitor Menu)
- Database Probe (from Database/ Monitor Menu)
- Knowledge Expert (from Utilities Menu)
- SQL Tracker (formerly SQL Monitor) -> An external
Application
that monitors SQL Statements issued by Windows apps running on
the sane
machine as TOAD. Very nice!!
- Alert Log Viewer -> Allows you to easily access the alert
log
of the DB and review it for issues.
- In Toad 10 file locations are no longer specified in the
registry. The location is stored in the SettingsLocation.ini
file found
under: C:\Documents and Settings\username\Application Data\Quest
Software\Toad for Oracle.
- Spotlight -> A diagnostic tool
Resources
collected from
Get to know Toad 8.0
Get to know Toad 8.5
Get to know Toad 8.6
Get to know Toad 9
Get to know Toad 9.1
Get to know
Toad 9.5
Get to know
Toad 9.6
Get to know
Toad 9.7
What's
new
in
Toad
10.5
Part
1
Toad
10.5
Release
Notes
Get to
know
Toad 10
Download Location
Toad DBA Suite for Oracle 10.5
http://www.taringa.net/posts/downloads/5349054/Utilidades-para-Bases-de-Datos.html
http://worlddownloads.quest.com.edgesuite.net/Repository/support.quest.com/Toad%20for%20Oracle/10.5/Software/Toad%20DBA%20Suite%20for%20Oracle%2010.5%20Commercial.exe
http://rapidshare.com/files/356251826/toad-keyg.rar